Blog
by Nortal
Connecting business with QA
How to use Google Spreadsheet for analytics and monitoring reports
We’ve all probably had a colleague fond of spreadsheets or a client in dire need of filling in those pesky reports — which, in turn, requires diving into monotonous data-fetching chores. This data collection typically, but not exclusively, involves several SQL queries — it might require chaining API calls and processing information based on the response.
In our example, we had two applications exchanging data via the X-Road — and both had significant alterations that made our client a bit skeptical concerning whether data transfer and processing remain working when live data is used. There was no built-in monitoring between the legacy systems and no resources to make one. The only way to be really sure that the flow successfully ended every time was to ask for reports. This made our client request monitoring information from both sides in an old-school manner by sending Excel files via email. Suffice to say, this presents the perfect opportunity for automation. Using light scripting and Google Spreadsheet, we’ll be able to hack our way through this.
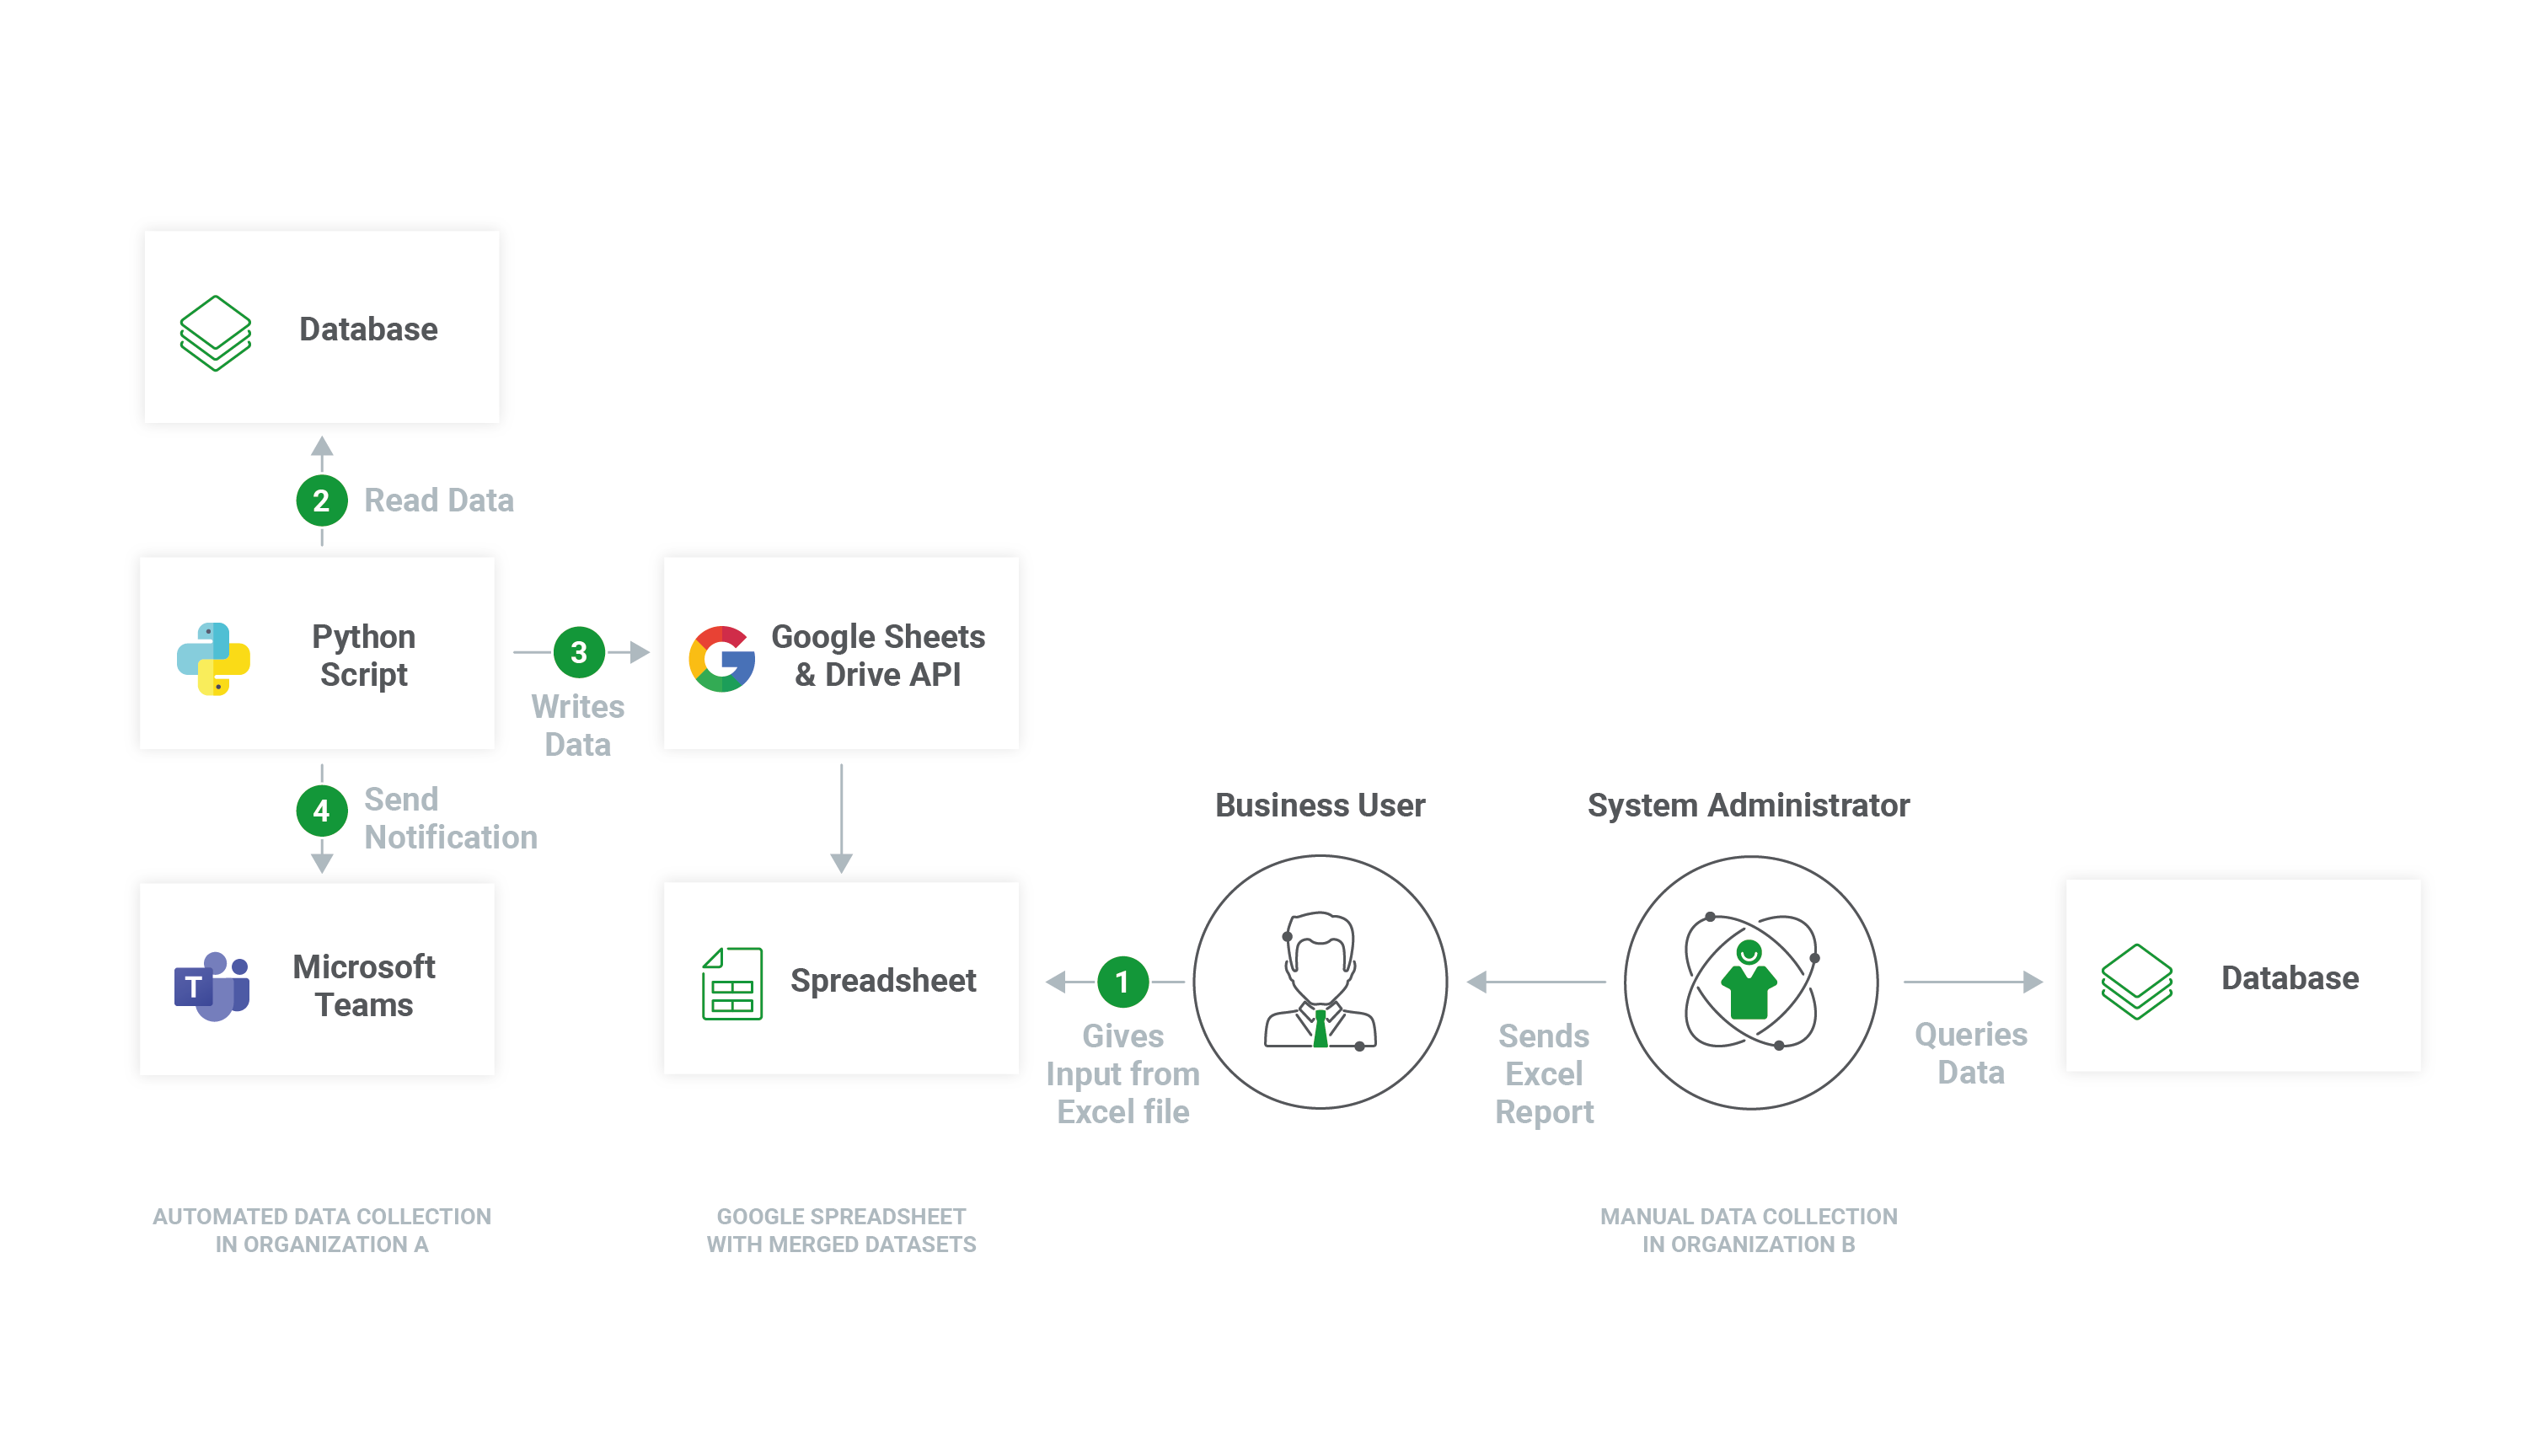 To-be solution, visualized. Organization A (us) goes for automation while organization B does the busywork
Goal 1: Connecting with Google Sheets & Drive API
To access data through Sheets API, we’ll require access to the file itself using Drive API. For both purposes, we’ve created a new project in Google APIs with all the related necessities: enabled the Sheets API, created a JSON key for using the API, shared the file for our new automated user.

Google APIs dash. New bot is ready to serve!
To ensure the data comes through, let’s run this Python script and use the downloaded credentials as an input to print the value of cell A2:
import pygsheets
import httplib2

# Read the spreadsheet API information from client_secret.json

http_client = httplib2.Http(timeout=50)
gc = pygsheets.authorize(service_file='automatesheet-274908-5feaa7864079.json', http_client=http_client)

# Open sheets
sh = gc.open("Casual business report")
main_sheet = sh.worksheet('title', Forms)

# Read query value if exists
query = main_sheet.cell('A2').value
print(query)
Goal 2: Link up the database
Connecting to a database using Python is a fairly straightforward job. For the Postgres database, we could use the psycopg2 package. In this instance, we’ll use the Oracle database and connect to it using the cx_Oracle package.
The main bulk of the heavy data processing is done on the SQL level, where we’ll separate subqueries using WITH clause and combine them in a single query:
WITH processing AS
 (
 SELECT person.identifier AS representative_id,
 system.prka_id AS process_id,
 variable.variable_number AS form_id,
 CASE WHEN system.state = 'E' THEN 'NOK' ELSE 'OK' END AS process_status
 FROM sys.pr_system system
 JOIN pr_system_variable variable ON variable.prka_id = system.prka_id
 JOIN document ON variable.variable_number = document.id
 JOIN person_document ON person_document.document_id = document.id
 JOIN person ON person.id = person_document.person_id
 WHERE system.ppro_kood = 'DOWNLOAD_DECISION'
 AND system.alg_aeg > TO_DATE(:start_date,'dd-mm-yyyy')
 GROUP BY person.identifier, system.prka_id, variable.variable_number, system.state
 ORDER BY system.prka_id DESC
 ),
main_service AS (...),
data_transfer_response AS (...)

SELECT main.form_id,
  main.applier_id,
  resp.data_transfer_status,
  proc.representative_id,
  proc.process_status,
  main.form_number,
  resp.end_time,
  resp.error
FROM main_service main
LEFT JOIN data_transfer_response resp ON main.xaus_id = resp.xaus_id
LEFT JOIN processing proc ON main.form_id = proc.form_id
From the script side, we’ll pass the correct date parameters, which our colleague presumably gave to us:
# Open query file
sql_file = open('resources/query.sql', 'r')
sql_query = sql_file.read()
sql_file.close()
try:
  con = cx_Oracle.connect(user, password, db)
  cursor = con.cursor()
  cursor.execute(sql_query, start_date="21-04-2020", end_date="15-05-2020")
except Exception as e:
  logger.error("Cannot connect to db: %s", e)
Goal 3: Update our spreadsheet
For updating the spreadsheet, we’ll use another output worksheet called “Data.” As the pygsheets module requires a different input format — and the dates are queried as datetime objects — we’ll also modify the query result before updating the datasheet.
rows = [list([i.strftime("%d/%m/%Y") if isinstance(i, datetime) else "-" if i == None else i for i in row]) for row in cursor]
data_sheet.update_values('A2:H2000', rows)
And if everything goes according to plan, we’ll see our data pop up in the spreadsheet:
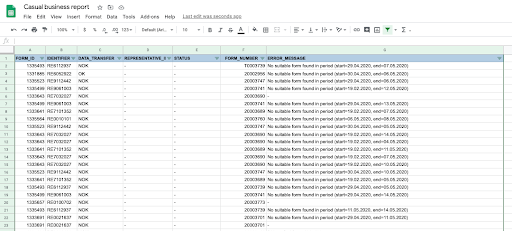
p.s. Whatever kind of data you intend to send to the spreadsheet, pay attention to data processing and storing regulations that apply to your application.
Goal 4: Finalizing our script
This workflow gives us an endless amount of flexibility, which is both visible for the business side and easy for us to expand upon. For example, we could use our exported data for processing within the spreadsheet. Let’s say the client handles another sheet named “Forms.” Let’s add a VLOOKUP comparison in the last column, and paint it accordingly to see the status of any given form according to our SQL report: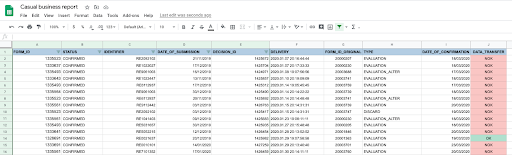
As another example, we could run our homebaked script from any Linux server — or any CI/CD orchestration or scheduling tool for that matter — and dynamically update the spreadsheet, so the business side has no actual reason to bother you anymore. If anything goes wrong, we can automatically create a notification to Slack, Teams, etc. For Teams, this is a three-line extension using the plugin pymstreams:
# Send notification to Teams
notification = pymsteams.connectorcard(connector)
notification.text(query_error)
notification.send()
Conclusion
Whenever you have the resources and dedication to create a truly extensive monitoring system, I would not recommend this solution. For example, we could apply contract testing to ensure we have as minimal risk as possible in the first place, and any issues that surface in production could be captured from logs and analyzed using Elastic stack.
However — as a sole QA member who has a mission to extend the dev support besides testing in the internal environment — this is a clear shortcut that is fast to deploy, fun to develop and flexible to extend.


Get in touch
Let us offer you a new perspective.